Technical analysis evaluates securities like shares, bonds, options and other financial instruments like currency pairs in forex.
This post examines the fundamental ideas and principles that all traders, whether new or experienced, should know whether.......................................
Although fundamental and technical analysis are two different approaches, the two financial asset analysis..........
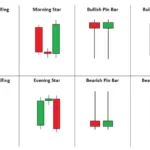
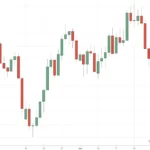
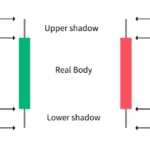
Japanese candlestick charts are a popular method of technical analysis used by traders and investors to analyze price movements in financial markets.
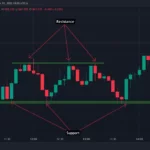
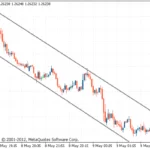
Price channels are a technical analysis tool that consists of two parallel lines drawn above and below the price action of an asset.
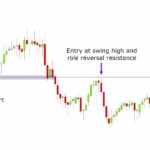
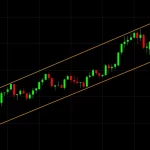
A trend line is a straight line that connects two or more points on the chart, usually representing the highs or lows of the data points.
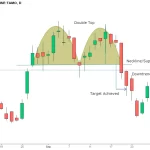
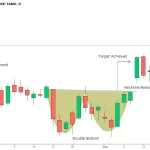
A double-top pattern is a pattern that appears as two peaks of approximately the same height, separated by a trough or a minor price decline.
A double-bottom chart pattern is a bullish reversal pattern in technical analysis that forms after a downtrend...........
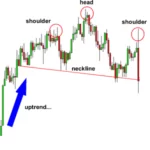
The Head and Shoulders chart pattern is a technical analysis formation used to identify a potential reversal in an asset's price trend.
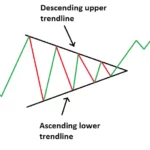
A symmetrical triangle is created by drawing trend lines connecting a series of highs and lows that gradually converge towards each other .......
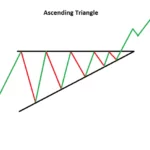
An ascending triangle is a bullish continuation pattern that forms when the price of an asset consolidates into a triangle shape, .............................
A descending triangle chart pattern is a technical analysis chart pattern that appears when the price of an asset is trading between a horizontal support ....

The Three Soldiers is a bullish reversal pattern that forms after a downtrend. It is a three-candlestick pattern in which ..............
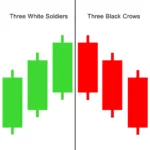
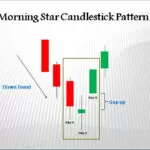
Triple candlestick patterns, or three-line patterns, are a subset of candlestick patterns that can provide ....................
Triple candlestick patterns are technical analysis tools commonly used by traders to identify potential changes in the direction of price movements.
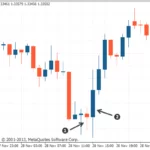
Engulfing patterns are two-candlestick patterns that occur when the following larger candlestick completely engulfs a small candlestick.
a Doji pattern appears when the opening and closing prices of an asset are almost the same, creating a cross-like shape..........
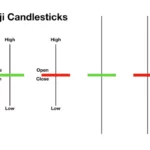
Single candlestick patterns are a type of technical analysis tool traders use to identify potential trends and reversals in the market.