
Technical analysis is a method of evaluating securities like shares, bonds, options and other financial instruments like currency pairs in forex by analyzing statistics generated by market activity, such as past prices and volume. Financial analysts, traders and investors aim to predict future price movements using technical analysis which is based on the study of historical market data, including price and volume. Past prices and volumes are gathered from various sources, including stock exchanges, financial data providers, and brokerage firms. The data is usually presented in a visual format, such as a bar chart, candlestick chart, or line chart, to help traders and investors quickly identify trends and patterns.
The presentation of this data is typically done by financial analysts, traders, and software programs. Financial analysts use various tools and techniques to collect and analyze market data. In contrast, traders use the information generated by these analyses to inform their investment decisions.
A brief history of Technical Analysis
The history of technical analysis dates back to the late 19th century, when Charles Dow, a co-founder of Dow Jones & Company, introduced the concept of charting price movements to analyze market trends. This method of analysis gained popularity over the next few decades and has since evolved to encompass a wide range of techniques and tools.
Charles Dow introduced the concept of charting price movement through his editorial work at the Wall Street Journal and through his own analysis of the stock market. Dow believed that the market was driven by investor psychology and that market trends could be predicted by analyzing price and volume data. To this end, Dow developed a method of plotting stock prices on a chart to track market trends over time. He used this method to track the performance of the industrial and transportation sectors, which he believed provided a good representation of the economy’s overall health. He is credited with developing the Dow Jones Industrial Average, which is still widely used as an indicator of today’s stock market performance.
Dow’s methods of charting price movements laid the foundation for technical analysis as we know it today. By using charts to represent market data visually, Dow made it easier for traders and investors to identify market trends and patterns and make informed investment decisions based on this information.
The components of technical analysis and a brief history.
These technical analysis components have rich histories, with many of the techniques and tools used by technical analysts having been developed over many decades. Here is a brief history of some of the critical components
Charts: Technical analysts use charts to represent market data, such as prices and volumes, over time. Charts help traders and investors to visualize trends and patterns in the market. The use of charts to represent market data can be traced back to the late 19th century, when Charles Dow introduced the concept of charting price movements to analyze market trends.
Indicators: Technical analysts use various mathematical formulas, known as indicators, to analyze market data and make predictions about future price movements. Some commonly used indicators include moving averages, Bollinger Bands, and the Relative Strength Index (RSI). The use of mathematical indicators in technical analysis can be traced back to the early 20th century, when traders and analysts first began to use various mathematical formulas to analyze market data. Some of the earliest indicators, such as moving averages and the Relative Strength Index (RSI), are still widely used today.
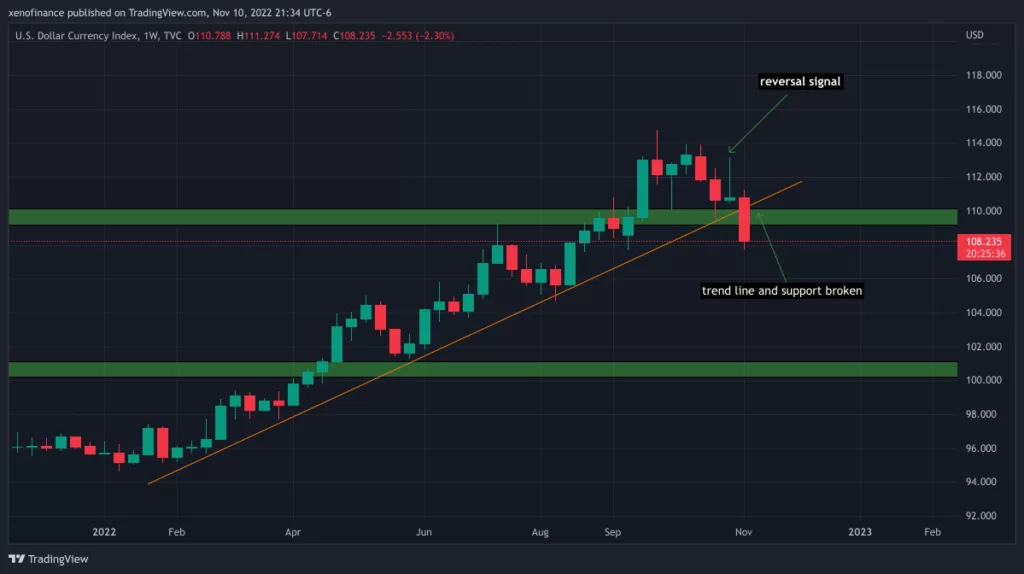
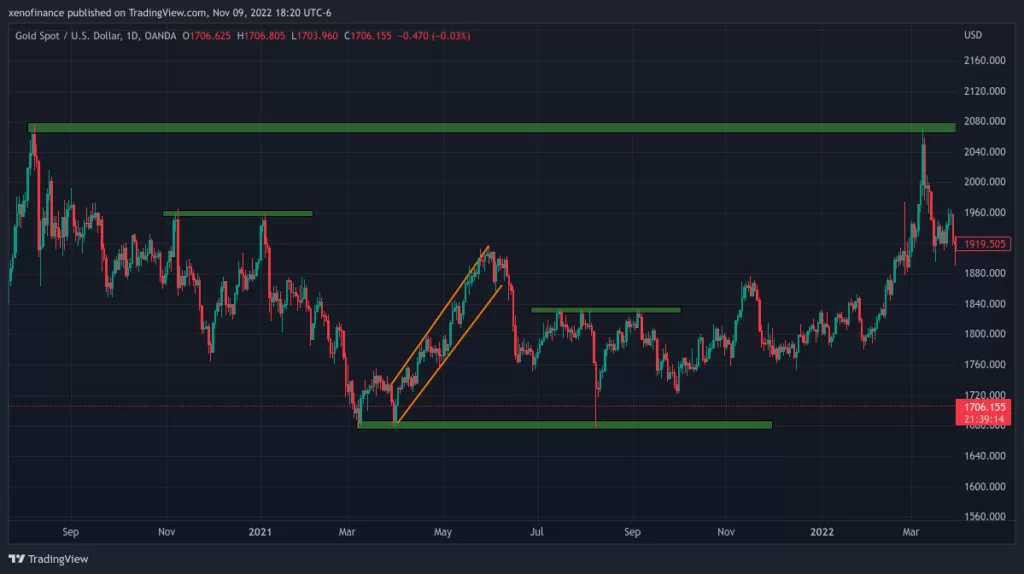
Trendlines: Technical analysts use trendlines to identify the overall direction of price movements and to determine the strength of a trend. Trendlines are drawn by connecting the highs or lows of a security over a given time period. The use of trendlines in technical analysis has been a part of the discipline for many decades. Trendlines are a simple and effective way to visualize the overall direction of price movements and to identify potential changes in market momentum.
Support and resistance levels: Technical analysts use support and resistance levels to determine the range in which a security is likely to trade. Support levels are the price levels where demand is expected to outweigh supply, while resistance levels are the price levels where supply is expected to outweigh demand. The concept of support and resistance levels has been used by technical analysts for many years. These levels are used to determine the range in which a security is likely to trade and to identify potential buy and sell opportunities.
Volume: Technical analysts also use volume data to validate price movements and identify potential market momentum changes. Increased volume is often seen as a sign of increased market interest in a security, while decreased volume can indicate a lack of market interest. The use of volume data in technical analysis can be traced back to the early days of the stock market, when traders and investors first began to use volume information to validate price movements and to identify potential changes in market momentum.
Patterns: Technical analysts look for recurring patterns in market data, such as head-and-shoulders patterns and cup-and-handle patterns, to make predictions about future price movements. Identifying patterns in market data, such as head-and-shoulders patterns and cup-and-handle patterns, has been a part of technical analysis for many decades. Traders and investors use these patterns to predict future price movements and identify potential buy and sell opportunities.
These are the main components of technical analysis, but technical analysts use many other techniques and tools. Technical analysis has evolved over the years to incorporate a wide range of techniques and tools, and it continues to evolve as traders and investors seek new and more effective ways to analyze market data.
Pingback: The Key concepts and principles of technical analysis - Xeno Finance