
Overview
A double-top chart pattern is a technical analysis pattern on a stock chart as two peaks of approximately the same height, separated by a trough or a minor price decline. This pattern is a bearish reversal pattern and indicates that the price of the asset may soon decline. It is formed when the price of an asset reaches a resistance level twice and fails to break above it, leading to a shift in market sentiment from bullish to bearish. The double-top chart pattern is confirmed when the price breaks below the neckline, which is drawn by connecting the two troughs between the two peaks.
Importance of recognizing double-top chart patterns in technical analysis
Recognizing double-top chart patterns is important in technical analysis for several reasons:
- Anticipation of a trend reversal: Double-top chart patterns are bearish reversal patterns, indicating that the bullish trend is likely to reverse. By identifying the pattern early on, traders can anticipate the change in trend direction and adjust their trading strategies accordingly.
- Entry and exit points: The double-top chart pattern provides clear entry and exit points for traders. Traders can enter short positions after the price breaks below the neckline and exit their positions when the price reaches the target price or the stop loss level.
- Risk management: The double-top chart pattern also helps traders manage their risk. The stop loss level can be set just above the second peak of the pattern, reducing the potential loss in case the trade goes against the trader.
- Confirmation of other indicators: Double-top chart patterns can confirm other technical indicators such as the Relative Strength Index (RSI) and Moving Averages (MA). A bearish divergence between the RSI and the price, or a crossover of the MA, can be used to confirm the bearish trend reversal suggested by the double-top chart pattern.
Characteristics of a double-top pattern
The following features characterize the double-top pattern:
- Two Peaks: The pattern consists of two peaks that are almost equal in height, indicating that the price of the asset has reached a resistance level twice.
- Trough: The two peaks are separated by a trough or minor price decline, which is also known as the neckline. The neckline connects the two troughs and serves as a support level.
- Volume: The volume of trading is usually high during the formation of the two peaks and decreases during the trough or minor price decline.
- Timeframe: The pattern can form over a period of weeks, months, or even years. The longer the timeframe, the more significant the pattern is considered.
- Confirmation: The pattern is considered confirmed when the price breaks below the neckline. Traders usually wait for the price to break below the neckline before entering a short position.
- Price Target: The price target of the pattern is usually calculated by measuring the distance between the neckline and the highest peak and subtracting it from the neckline level. This gives an estimate of how far the price could decline after breaking below the neckline.
In summary, the double top pattern is characterized by two almost equal peaks separated by a trough, high trading volume during the formation of the peaks, a neckline that connects the two troughs, confirmation when the price breaks below the neckline, and a price target calculated by measuring the distance between the neckline and the highest peak.
Example:
From the below example of the daily chart of Tata Motors Ltd. we can see how bearish reversal takes places after the formation of the double top at the end of an uptrend:
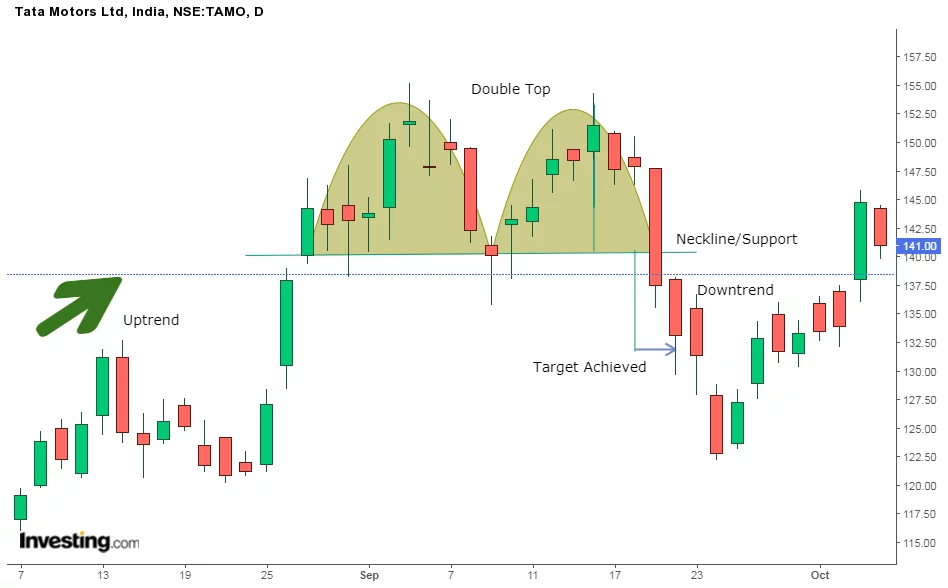
Source; Investing / Ig
Ryanair Holdings PLC (LSE) Double Top Chart Pattern:

Trading the double-top chart pattern
Trading the double-top chart pattern involves the following steps:
- Identify the pattern: The first step is to identify the double top chart pattern on the price chart of the asset being traded. The pattern consists of two almost equal peaks separated by a trough or minor price decline, with a neckline connecting the two troughs.
- Wait for confirmation: The pattern is considered confirmed when the price breaks below the neckline. Traders usually wait for the price to break below the neckline before entering a short position.
- Enter the trade: Once the pattern is confirmed, traders can enter a short position. The entry point is usually just below the neckline, with a stop loss placed just above the second peak of the pattern.
- Determine profit target: The profit target is usually calculated by measuring the distance between the neckline and the highest peak of the pattern and subtracting it from the neckline level. This gives an estimate of how far the price could decline after breaking below the neckline.
- Manage risk: Traders should also manage their risk by setting a stop loss level and adjusting it as the price moves in their favor. Traders should also consider taking partial profits or moving their stop loss to breakeven once the price reaches their profit target.
- Monitor the trade: Traders should monitor the trade closely and consider closing the position if the price starts to move against them or if there is a significant change in the market conditions.
Limitations of double top chart pattern analysis
While the double top chart pattern can be a useful tool for traders, there are several limitations to its analysis:
- False signals: Like any technical analysis tool, the double top chart pattern is not foolproof and can produce false signals. It is possible for the price to form two almost equal peaks without indicating a trend reversal.
- Ambiguous neckline: The neckline of the pattern is subjective and can be drawn differently by different traders, leading to different interpretations of the pattern.
- Timeframe: The pattern can take a long time to form, which may make it less useful for short-term traders.
- Low trading volume: The pattern requires high trading volume during the formation of the two peaks to be reliable. If the volume is low, the pattern may not be as significant.
- Conflicting signals: The double-top chart pattern may conflict with other technical analysis tools, such as the Relative Strength Index (RSI) or Moving Averages (MA). Traders should consider these other indicators when interpreting the pattern.
- Limited risk-reward ratio: The profit potential of the pattern is limited by the distance between the neckline and the highest peak, which may not be sufficient for some traders.
Conclusion
The double-top chart pattern is a technical analysis tool traders use to identify potential trend reversals in the price of an asset. The pattern consists of two almost equal peaks separated by a trough or minor price decline, with a neckline connecting the two troughs. The pattern is confirmed when the price breaks below the neckline, and traders can enter a short position with a profit target calculated by measuring the distance between the neckline and the highest peak.
However, the pattern has several limitations, such as false signals, ambiguous neckline, long timeframe, low trading volume, conflicting signals, and limited risk-reward ratio. Traders should consider combining the pattern with other technical analysis tools and using proper risk management techniques to minimize the impact of these limitations on their trading decisions.