
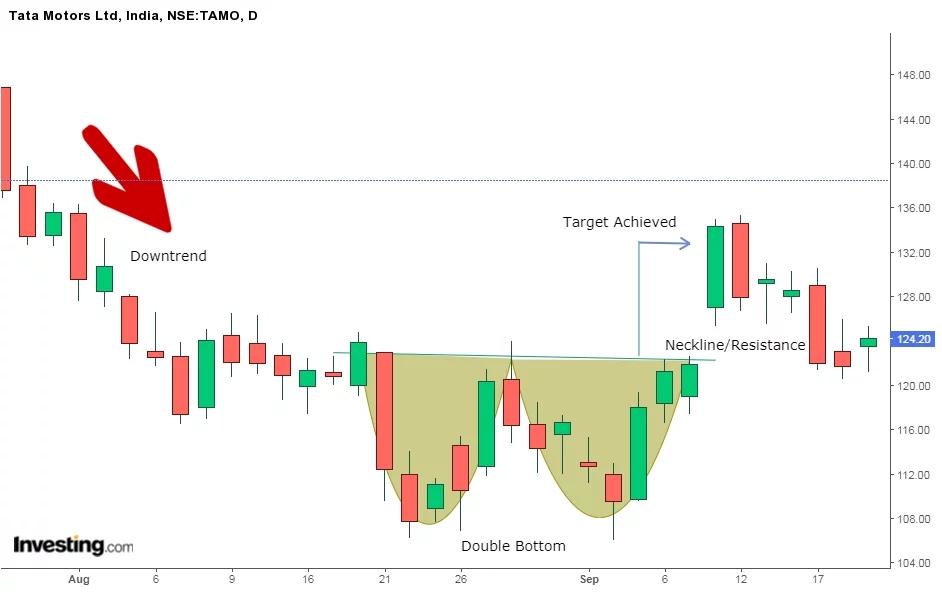
A double-bottom chart pattern is a bullish reversal pattern in technical analysis that forms after a downtrend. It is characterized by two consecutive bottoms or lows that are roughly equal in price, separated by a peak or a high in between. The two lows create a support level that traders look for to hold as a signal that the price will likely move higher.
Once the price breaks above the peak or high between the two lows, it is seen as a confirmation of the pattern and a potential buy signal for traders. The pattern is considered complete when the price rises above the high point between the two lows. The double bottom chart pattern is the opposite of the double top chart pattern which is a bearish reversal pattern.
Importance of double bottom chart pattern in technical analysis
A double-bottom chart pattern is an important tool in technical analysis for several reasons:
- Reversal signal: The pattern is a bullish reversal signal, indicating that the price trend is likely to reverse from a downtrend to an uptrend. This makes it an important signal for traders who are looking to enter into long positions or exit short positions.
- Confirmation: Once the price breaks above the high point between the two lows, it is seen as a confirmation of the pattern, increasing the reliability of the signal and indicating that the price is likely to continue moving higher.
- Support level: The two lows of the pattern create a strong support level that traders can use to set stop-loss orders to limit their risk. This support level also provides traders with a potential entry point if the price bounces off the support level.
- Target price: The distance between the two lows of the pattern can be used to estimate a target price for the trade. This can help traders set profit targets and manage their risk-reward ratio.
Identifying a double bottom chart pattern
Identifying a double-bottom chart pattern requires a keen eye for price action and an understanding of the pattern’s characteristics. Here are the key steps to identify a double-bottom chart pattern:
- Look for a downtrend: A double-bottom chart pattern forms after a downtrend, so the first step is to identify a clear downtrend in the price action.
- Two equal lows: Look for two consecutive price lows that are roughly equal in price, forming a horizontal support level. These lows should be separated by a peak or a high in between.
- Volume: Volume can be a useful indicator in identifying a double-bottom chart pattern. Typically, the volume will be higher on the left side of the pattern, during the formation of the first bottom, and then decrease on the right side, during the formation of the second bottom. This decrease in volume indicates a lack of selling pressure and a potential shift in sentiment.
- Confirmation: Once the price breaks above the high point between the two lows, it is seen as a confirmation of the pattern. This is the point where traders may consider entering into long positions or exiting short positions.
- Resistance-turned-support: After the price breaks above the high point, the previous resistance level becomes a new support level for the price.
It’s important to note that the two lows in a double-bottom chart pattern do not need to be exact, but they should be relatively close in price. Additionally, it is recommended to look for the pattern on a longer timeframe chart, such as daily or weekly, to avoid false signals that may occur on shorter timeframes.
Trading strategies using double-bottom chart pattern
Trading strategies using the double-bottom chart pattern can be effective in capturing potential bullish reversals in the market. Here are some key trading strategies to consider:
- Buy signal and stop-loss placement: Once the price breaks above the high point between the two lows, it is seen as a confirmation of the pattern and a potential buy signal for traders. Traders can enter into long positions at this point, with a stop-loss order placed below the second low of the pattern. This stop-loss placement ensures that traders limit their risk and exit the trade if the price falls below the support level.
- Profit target and exit strategy: The distance between the two lows of the pattern can be used to estimate a target price for the trade. Traders can set their profit target at a multiple of this distance, such as two or three times the distance between the lows. Additionally, traders may consider using technical indicators, such as moving averages or Fibonacci retracements, to identify potential resistance levels and exit the trade when the price approaches these levels.
- Risk management and position sizing: It is important to manage risk and position size when trading using the double-bottom chart pattern. Traders can use a risk-reward ratio of 1:2 or 1:3 to ensure that the potential reward is higher than the potential risk. Additionally, traders can adjust their position size based on the distance between the stop-loss and entry price, ensuring that they are not risking more than they can afford to lose.
Limitations and drawbacks of double-bottom chart pattern
While the double-bottom chart pattern can be a useful tool for traders, it is important to be aware of its limitations and drawbacks. Here are some of the potential limitations and drawbacks of the double-bottom chart pattern:
- False signals: Like any chart pattern, the double bottom chart pattern is not foolproof and can generate false signals. It is important to wait for confirmation of the pattern, such as a break above the high point between the two lows, before entering into a trade.
- Small profit potential: The profit potential of the double bottom chart pattern may be limited, as the target price is often based on the distance between the two lows of the pattern. In some cases, this distance may be relatively small, limiting the potential profit of the trade.
- Limited time frame: The double bottom chart pattern is most effective on longer timeframes, such as daily or weekly charts. On shorter timeframes, such as hourly or 15-minute charts, the pattern may be less reliable.
- Over-reliance on technical analysis: Relying too heavily on technical analysis, such as chart patterns, can lead to missed opportunities or losses if other factors, such as market news or economic indicators, are not taken into account.
- Market conditions: Like any trading strategy, the double-bottom chart pattern may not be effective in all market conditions. Traders should be aware of market conditions, such as high volatility or low liquidity, that may affect the reliability of the pattern.
Advantages double bottom chart pattern
The double-bottom chart pattern offers several advantages to traders who are looking to identify potential bullish reversals in the market. Here are some of the key advantages of the double-bottom chart pattern:
- Clear reversal signal: The double bottom chart pattern provides a clear signal that a potential bullish reversal is taking place in the market. Traders can use this signal to enter into long positions and capture potential profits as the price continues to rise.
- Well-defined support level: The two lows in the double bottom chart pattern form a well-defined support level that traders can use to manage risk. By placing a stop-loss order below the second low, traders can limit their potential losses if the price falls below the support level.
- Easy to identify: The double bottom chart pattern is relatively easy to identify, even for novice traders. By looking for two lows that are roughly equal in price and separated by a peak or high, traders can quickly identify potential bullish reversals in the market.
- Reliable on longer timeframes: The double bottom chart pattern is most effective on longer timeframes, such as daily or weekly charts. On these timeframes, the pattern is more reliable and less prone to false signals, providing traders with a higher degree of confidence in their trades.
- Can be used in conjunction with other indicators: The double bottom chart pattern can be used in conjunction with other technical indicators, such as moving averages or momentum oscillators, to provide additional confirmation of the potential reversal.
Conclusion
The double-bottom chart pattern is a reliable and effective tool for identifying potential bullish reversals in the market. This pattern is characterized by two lows that are roughly equal in price and separated by a peak or high, and can be used on longer timeframes, such as daily or weekly charts, to provide a clear signal of a potential reversal.
Traders can use the double-bottom chart pattern to enter into long positions and capture potential profits as the price continues to rise. By placing a stop-loss order below the second low, traders can limit their potential losses if the price falls below the support level.
While the double bottom chart pattern does have some limitations and drawbacks, such as false signals and limited profit potential, it can be a valuable tool when used in conjunction with other technical indicators and analysis.
Overall, the double bottom chart pattern is a useful addition to any trader’s toolkit, providing a clear signal of potential bullish reversals and well-defined support levels to manage risk. By understanding the strengths and weaknesses of this pattern, traders can make informed trading decisions and capture potential profits in the market.